
Ethereum Breaks Above Key Level Against Bitcoin, Sparking Bullish Cycle Talk
Ethereum rallied on Monday and pushed toward highs it hasn’t seen since late 2021, reaching $4,780 during the session.
Traders and funds appear to be reallocating capital into ETH, and several on-chain and market indicators are lining up in its favor.
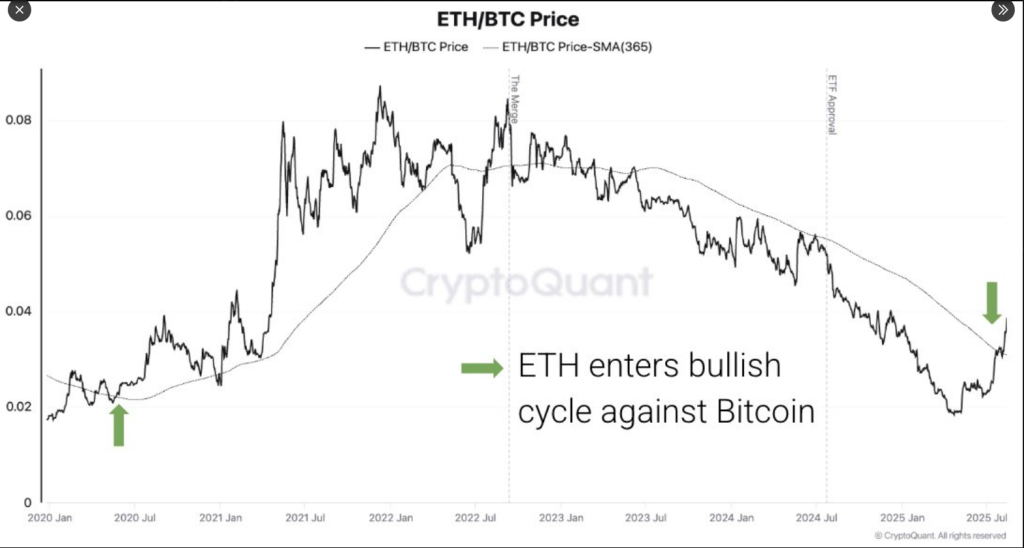
According to CryptoQuant, the ETH/BTC price ratio has crossed above its 365-day moving average, a technical move that has often marked the start of stronger runs for Ethereum versus Bitcoin.
ETF Demand Pours In
According to fund flow reports, US spot Ethereum ETFs pulled about $1 billion in a single trading day, with BlackRock’s ETHA taking in $640 million and Fidelity’s FETH adding $277 million.
ETH is breaking out vs BTC.
The ETH/BTC price ratio just crossed above its 365-day moving average.
A level that’s historically marked the start of bullish ETH cycles. pic.twitter.com/qyLDDK9Xhc
— CryptoQuant.com (@cryptoquant_com) August 14, 2025
ETF holdings now total roughly $26 billion, and cumulative inflows this cycle are close to $11 billion. That kind of money is meaningful because it reflects tracked institutional and retail demand entering ETFs rather than the untracked corners of crypto markets.
Spot And Futures Show The Same Bias
Market data also points to growing interest in ETH in both spot and derivatives markets. Reports show open interest in Ethereum derivatives rising faster than Bitcoin’s, and perpetual futures positioning has picked up.
On the spot side, CryptoQuant’s volume ratio put ETH’s trading activity at 1.66 relative to BTC last week — the highest level since June 2017 — and over the last four weeks ETH spot volume ran about $24 billion versus Bitcoin’s $14 billion.
Some on-chain indicators are flashing caution. Daily ETH inflows into exchanges have climbed and now top those of Bitcoin, suggesting that holders may be moving coins back to exchanges to sell into higher prices.
Historically, rising exchange inflows near key technical resistance can precede short-term pullbacks, and analysts are watching those flows closely as a potential sign of profit-taking.
Why The Ratio MattersThe ETH/BTC ratio is getting extra attention because it measures relative strength between the two largest crypto assets.
Crossing above long-run moving averages like the 365-day line can attract momentum traders and funds that follow technical signals.
Still, past breakouts have sometimes reversed quickly, so traders are balancing bullish bets with protective measures like trimming positions or using stop orders.
Flow data will be decisive in the coming days. If $1 billion ETF inflow days repeat and open interest keeps rising, momentum could continue. If exchange inflows accelerate and ETF demand cools, price action could stall.
Featured image from Meta, chart from TradingView